
As an independent news outlet, we enjoy the privilege of covering issues that bigger outlets won’t. At Los Angeleno, we write about people, places and idiosyncrasies with local impact and beyond. Your support is vital for us to continue doing so.
With your help, we can continue to write the first draft of history in Los Angeles. Check out our membership options and join today!
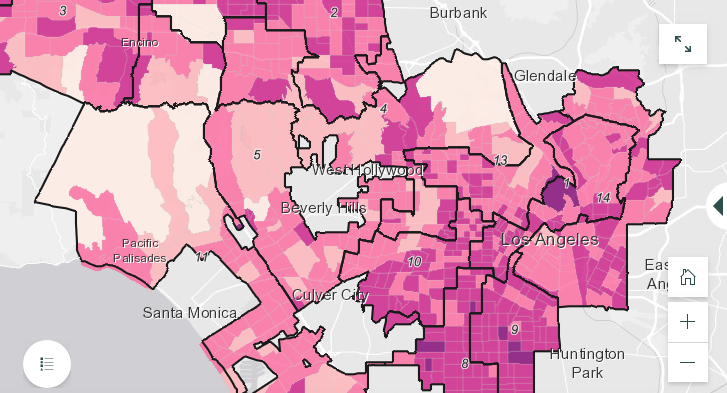
Today, L.A. City Controller Ron Galperin released a new report accompanied by interactive maps that show how opportunities vary for Angelenos in different neighborhoods. “A Great Divide: L.A. Equity Index” shines a light on disparities that exist across Los Angeles.
Things like a community’s access to education, resources and other services, as well as local environmental and socioeconomic conditions, are calculated to give each census tract in the city an “Equity Index” score from 1 to 10. A lower score means residents experience less equity and opportunity. Lower scores are denoted on the map by a dark purple color, while higher scores are pale pink.
“Living in an area with a lower score on the Equity Index means that it is exponentially harder to achieve the health, economic and educational outcomes than people living in an area that achieves a higher score,” the report reads. If you’re curious to see your neighborhood’s Equity Index score, you can enter your address into the search bar on the first map.
The report features even more interactive maps breaking down various scoring factors. For example, one map shows where most rent-burdened Angelenos live. (Turns out Los Angeles is the third-most rent-burdened city in the nation.) Other maps track which communities breathe in toxic chemicals because they live near facilities that release them, as well as residents’ educational levels, homeownership and access to the internet, health insurance and grocery stores.
The takeaway? L.A. is a “deeply divided” city of 4 million people, something we probably already knew simply by observing the conditions in Skid Row compared to life in the Hollywood Hills. West L.A. and parts of the West San Fernando Valley show the highest equity scores, while areas of South and East L.A. have some of the lowest.
“[Los Angeles] is incredibly geographically, demographically and economically diverse, but there is a great equity divide,” Galperin said in a press release. “Too many neighborhoods face barriers to opportunity that negatively impact the people who live there, many of whom are people of color and immigrant families.”
The L.A. Equity Index is meant to provide residents and policymakers with a better understanding of the issues local communities face so that we can make data-driven decisions about how to improve the quality of life for everyone.
“To bridge the divide, Los Angeles needs to do better and invest smarter in the communities that need it most,” Galperin said.